Canadian Tire
Turning supply chain variance into operational insight and decision support
Business Analyst, Supply Chain · 2024–2025
Built dashboards, analyzed late freight and set-to-ship exceptions, and self-initiated a Python model to connect operational delays to downstream claims.
Canada's largest distribution centre had persistent late freight and 'set-to-ship' exceptions, with no real-time view of either.
Metrics existed only in static reports. The link between operational delays upstream and dealer claims downstream was assumed, not measured.
Build the operational view first, then go beyond the brief and quantify the cost of variance.
Defined shipping metrics, wrote SQL / Oracle queries, shipped Power BI dashboards with control-chart thresholds, applied A3 / Six Sigma to two persistent issues, and self-initiated a Python model linking late freight to dealer claims.
~20% reduction in set-to-ship exceptions and an AVP-level presentation that gave leadership a financially grounded case for prioritizing late freight.
Productize the model — embed it as a live dashboard component so the predicted claims impact updates as operations change, not as a one-off insight.
Detailed file
Context
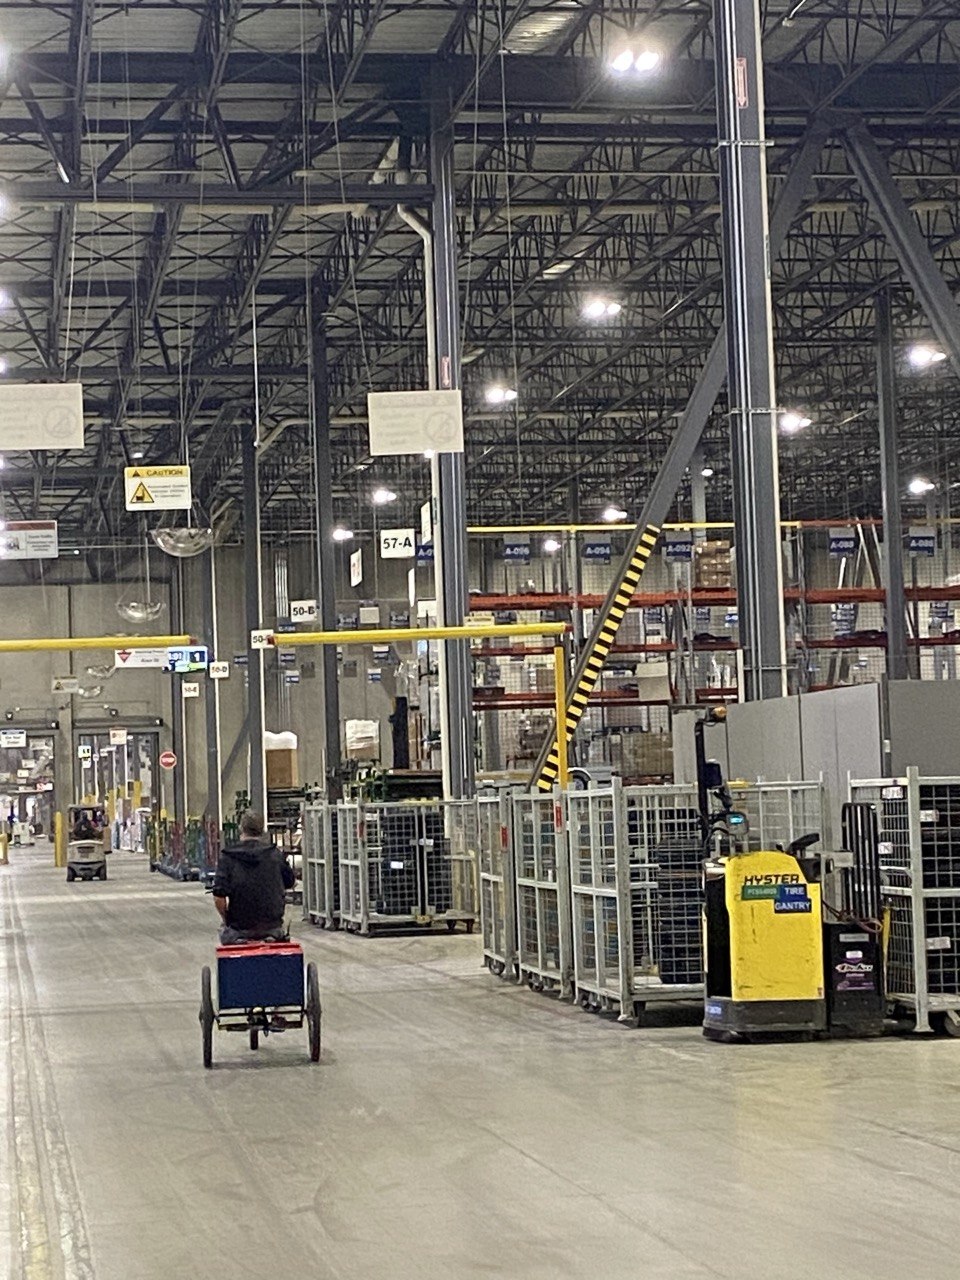
Canadian Tire's Bolton Distribution Centre is the largest distribution centre in Canada — a 1.4M sq. ft. facility processing shipments to hundreds of dealer stores. I was embedded in the shipping department.
Analytics foundation
Defined key shipping metrics — late freight, set-to-ship exceptions, trailer loading accuracy, dealer claims. Wrote SQL and Oracle SQL queries to extract data across systems, built Power BI dashboards giving supervisors their first real-time operational view. Used control chart thresholds to detect when metrics went out of range.
Root cause analysis
Applied A3 / Six Sigma methodology to two persistent issues — late freight and set-to-ship exceptions (where the system assumed a product was loaded when it wasn't). Conducted root cause analysis using 5 Whys frameworks, validated findings on the warehouse floor with supervisors, implemented countermeasures — resulting in ~20% reduction in set-to-ship exceptions.
Self-initiated ML model
Without being asked, built a predictive model in Python using historical late freight and dealer claims data to quantify the relationship between the two. The model allowed simulation: if we reduce late freight by X%, what is the expected reduction in dealer claims? Gave leadership a financially grounded case for prioritizing late freight reduction.